How to Work with Website Heatmap Data
Learn how to effectively analyze and interpret website heatmap data to optimize your site's performance and user experience. This guide covers different types of heatmaps, setup processes, interpretation techniques, and best practices for leveraging heatmap insights.

In the ever-evolving landscape of digital marketing and web design, understanding user behavior is paramount to creating successful online experiences. One of the most powerful tools at our disposal for gaining these insights is the website heatmap. Heatmaps provide a visual representation of user interactions on your website, offering a wealth of information that can be leveraged to optimize design, improve user experience, and ultimately drive conversions. This comprehensive guide will walk you through the intricacies of working with website heatmap data, from understanding different types of heatmaps to implementing data-driven improvements on your site.
Understanding Different Types of Heatmaps
Before diving into the analysis of heatmap data, it's crucial to familiarize yourself with the various types of heatmaps available. Each type offers unique insights into user behavior and can be used to address specific aspects of your website's performance.
Click Heatmaps
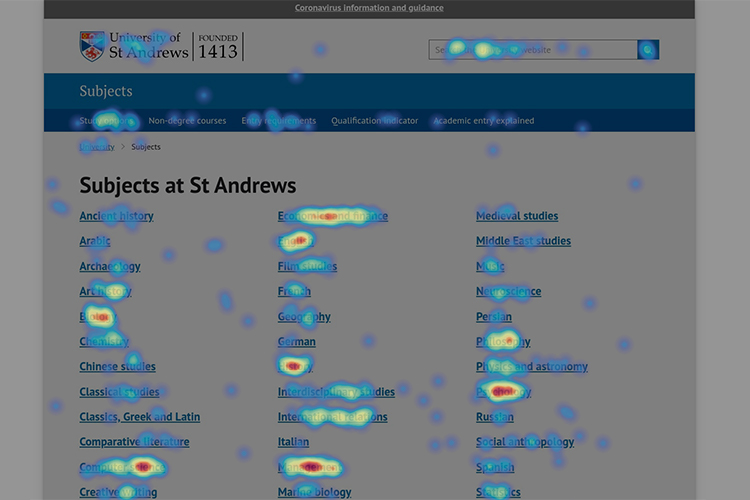
Click heatmaps are perhaps the most straightforward and commonly used type. They display where users are clicking on your website, with "hot" areas indicating high click activity and "cold" areas showing less interaction. This information is invaluable for understanding which elements of your page are attracting the most attention and which might be overlooked.
Move Heatmaps
Move heatmaps track the movement of users' cursors across your web pages. While not every mouse movement correlates directly with eye movement, studies have shown a strong correlation between the two. Move heatmaps can provide insights into what content users are hovering over or considering, even if they don't ultimately click.
Scroll Heatmaps
Scroll heatmaps illustrate how far down your web pages users are scrolling. This data is particularly useful for understanding at what point users tend to lose interest or abandon the page. It can help you optimize the placement of important content and calls-to-action to ensure they're seen by the maximum number of visitors.
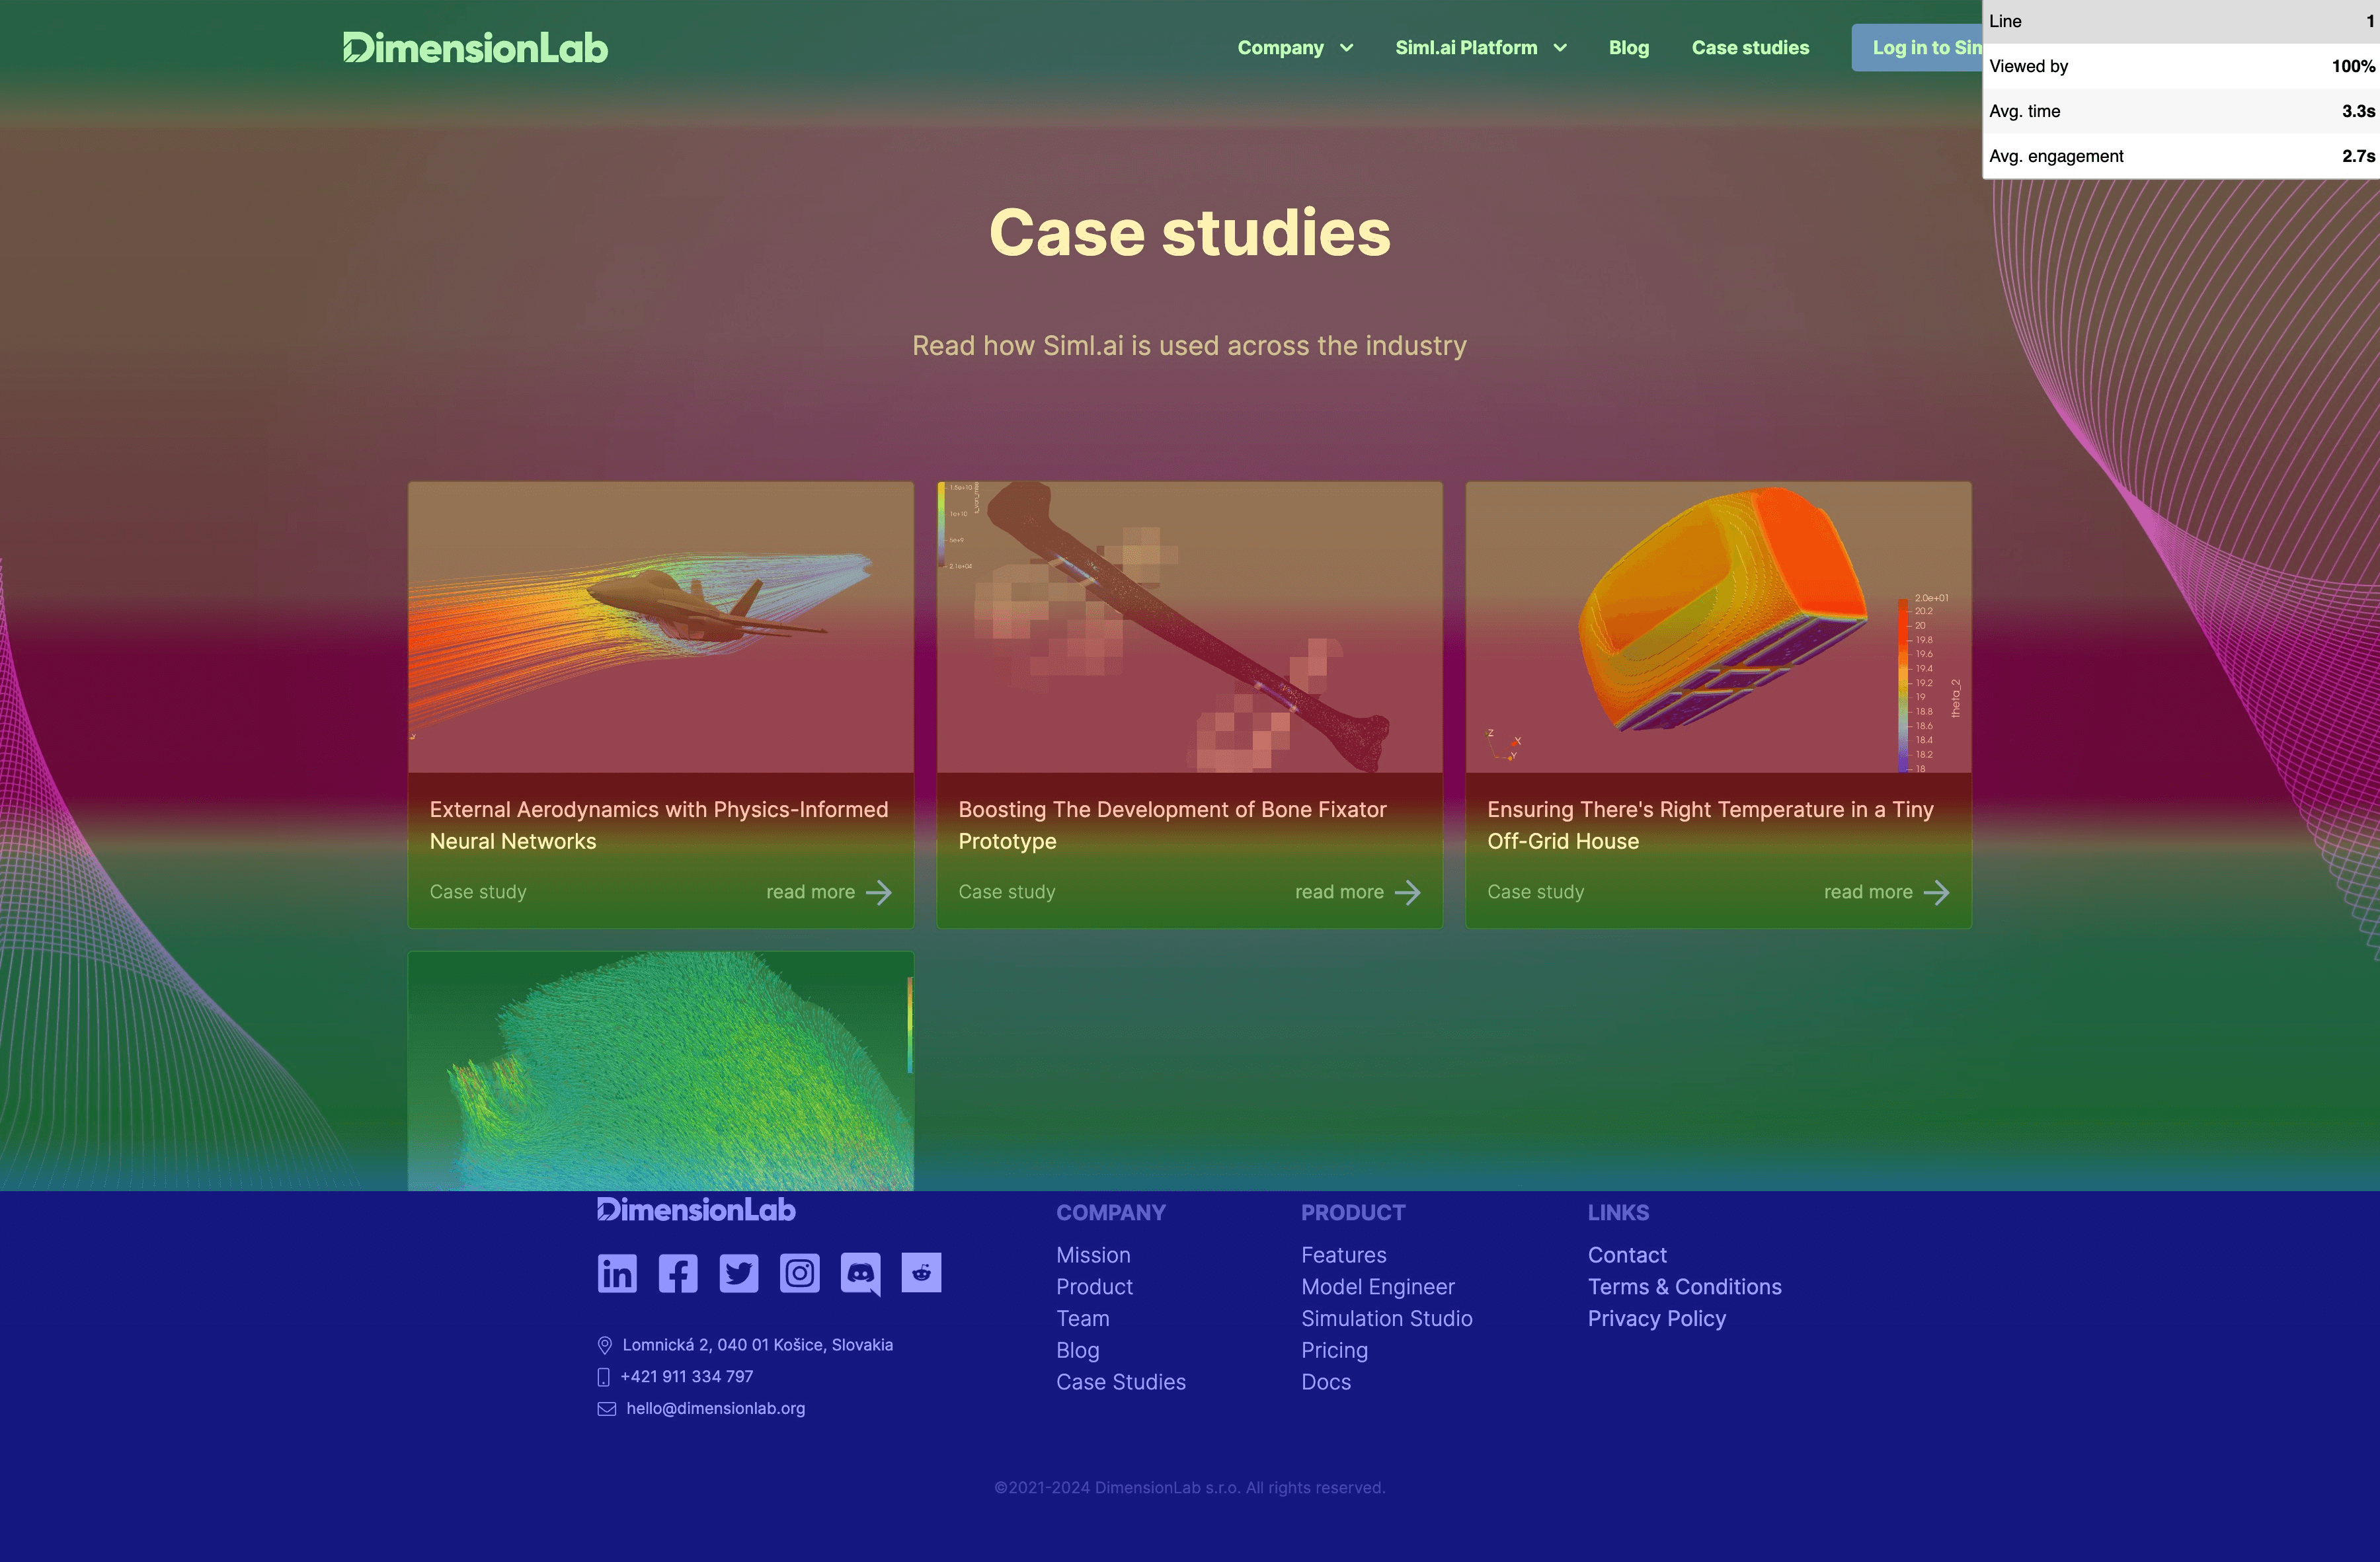
Attention Heatmaps
Attention heatmaps combine data from click, move, and scroll heatmaps to create a comprehensive view of where users are focusing their attention on your website. These can be especially useful for getting a holistic understanding of user engagement across your entire page.
Setting Up Heatmap Analysis
To begin working with heatmap data, you'll need to set up a heatmap analysis tool on your website. The process typically involves the following steps:
-
Choosing the right heatmap software: There are numerous heatmap tools available, ranging from basic free options to comprehensive paid solutions. Here are few of them: Mouseflow, Hotjar, Microsoft Clarity, Heatmap.com. Consider factors such as ease of use, integration capabilities, and the specific features you need when making your selection.
-
Installing and configuring the tool: Most heatmap software can be installed by adding a small snippet of code to your website. This code allows the tool to track user interactions and generate heatmaps. Follow the provider's instructions carefully to ensure proper installation.
-
Selecting pages for analysis: Decide which pages on your website you want to analyze. It's often beneficial to start with high-traffic pages or those crucial to your conversion funnel.
-
Determining the duration of data collection: Set a timeframe for data collection. This can vary depending on your site's traffic volume, but generally, you'll want to collect data for at least a week to ensure a representative sample of user behavior.
Interpreting Heatmap Data
Once you've collected heatmap data, the next step is to interpret it effectively.
Heatmaps typically use a color spectrum to indicate the level of user interaction, with warmer colors (reds and oranges) representing high activity and cooler colors (blues and greens) representing less activity. Pay attention to these color variations to quickly identify areas of high and low engagement.
Look for clusters of warm colors to identify "hot zones" where users are most actively engaging with your site. Conversely, areas with predominantly cool colors are "cold zones" that may be underperforming or overlooked by users.
Look for patterns in user behavior. Are users consistently clicking on non-clickable elements? Are they ignoring important calls-to-action? These patterns can reveal usability issues or opportunities for improvement.
User behavior often differs significantly between desktop and mobile devices. Analyze heatmaps for both to ensure your website is optimized for all users, regardless of the device they're using.
Key Metrics to Focus On
While heatmaps provide a wealth of data, certain metrics are particularly valuable for understanding user behavior and improving your website:
-
Click-through rates: Pay attention to which elements are receiving the most clicks and which are being ignored. This can help you optimize the placement and design of important links and buttons.
-
Scroll depth: Understanding how far users typically scroll can help you determine the optimal length for your pages and where to place crucial information.
-
Time spent on page: Areas where users spend more time can indicate engaging content or, conversely, confusing elements that require clarification.
-
Mouse movement patterns: Analyze how users move their cursors around your page. This can provide insights into the logical flow of your content and design.
Common Heatmap Insights and Their Implications
Heatmap analysis often reveals common patterns that have significant implications for your website's performance:
-
Above-the-fold content engagement: Heatmaps can show whether users are engaging with content above the fold or immediately scrolling past it. This insight can help you optimize your most valuable real estate.
-
Navigation effectiveness: Click heatmaps can reveal whether users are finding and using your navigation elements as intended. Low engagement with navigation items might indicate a need for redesign or repositioning.
-
Call-to-action performance: Heatmaps can show whether your CTAs are attracting attention and clicks. If they're not, you may need to adjust their design, wording, or placement.
-
Content relevance and placement: Areas of high engagement indicate content that resonates with users, while ignored sections might need to be revised or relocated.
Using Heatmap Data to Improve Website Design
The ultimate goal of heatmap analysis is to improve your website's performance. Here are some ways to apply your insights:
-
Optimizing page layout: Use heatmap data to inform the arrangement of elements on your page. Place important content and CTAs in areas of high user engagement.
-
Enhancing user experience (UX): Identify and address usability issues revealed by heatmaps, such as confusing navigation or overlooked content.
-
Refining content strategy: Focus on creating more of the type of content that heatmaps show users engaging with most.
-
A/B testing based on heatmap insights: Use heatmap data to inform hypotheses for A/B tests, allowing you to validate your insights and continually improve your site.
Best Practices for Heatmap Analysis
To get the most out of your heatmap data, follow these best practices:
-
Regular data collection and analysis: User behavior can change over time, so regularly collect and analyze heatmap data to stay on top of trends.
-
Combining heatmaps with other analytics tools: Use heatmaps in conjunction with other analytics tools for a more comprehensive understanding of user behavior.
-
Segmenting data for deeper insights: Analyze heatmaps for different user segments (e.g., new vs. returning visitors) to uncover more nuanced insights.
-
Avoiding common interpretation pitfalls: Be cautious of drawing conclusions from limited data or misinterpreting color intensity. Always consider the context of your website and audience.
Conclusion
Working with website heatmap data is a powerful way to gain insights into user behavior and optimize your website's performance. By understanding different types of heatmaps, effectively interpreting the data, and applying the insights to your website design and content strategy, you can create a more engaging and effective online experience for your users. Remember that heatmap analysis is an ongoing process – regularly collecting and analyzing data will allow you to continually refine and improve your website, staying ahead in the ever-changing digital landscape. Start implementing these strategies today, and watch as your website's performance and user satisfaction soar to new heights.
Related reading
Heatbot 2.0: Empowering Teams, Credits-based Pricing & Improved Studio
Discover the updates in Heatbot 2.0, featuring a revamped credit system, introduction of team management, and collaboration features that empower your creative projects.
Mouseflow vs Microsoft Clarity for Website Heatmaps
Learn how to effectively analyze and interpret website heatmap data to optimize your site's performance and user experience. This guide covers different types of heatmaps, setup processes, interpretation techniques, and best practices for leveraging heatmap insights.
Designing High-Converting Websites Based on Heatmaps
Learn how to design high-converting websites using heatmaps. Discover tools, techniques, and case studies.

Co-Founder & CEO of DimensionLab
Michal is a CEO of DimensionLab, a company developing AI-driven simulation software. He's a seasoned software engineer with a passion for building products that help people and businesses succeed, focused on deep tech, AI, and latest technologies.